 Cherry tomatoes contaminated with salmonella: 92 sick and 1 dead
  A better coaching method can make a person grow
  What is the method to prevent diabetes in children?
  What are the effective factors in causing stomach ulcers?
  Why do embarrassing memories seem to appear at night?
 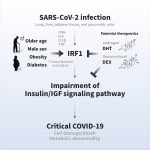 The amazing link between SARS-CoV-2 infection and newly started diabetes
  WHO says monkey pox is not a global emergency right now
  Single cell RNA sequencing uncovers new mechanisms of heart disease
  Hepatitis of unknown origin: 3 new deaths and 228 cases worldwide
Two weeks of “external confinement” have already passed, and even three for some departments. But can these types of restrictions really curb the epidemic?
The date of April 3 on which this confinement was put in place complicates the answer. Indeed, from April 3 to 5, the number of tests carried out collapses around Easter Monday. However, the data collected since by the health authorities make it possible to observe the very first effects of the restrictions.
Read also: Covid: is confinement at weekends an effective measure?
Decrease in the 16 departments
The elapsed duration of confinement differs depending on the region: the effects are first felt in the first 16 departments, confined on March 20. As a reminder, these are Hauts-de-France and Ile-de-France, Eure, Seine-Maritime and Alpes-Maritimes.
Thus, the incidence rate reached a peak around March 31 in these territories (blue curve below). Subsequently, it began a slow descent which seems to continue after the three-day weekend.
Source: CovidTracker
Read also: Covid: saturated resuscitation “at least until mid-May” in Lyon
Stability in the rest of the territory
With regard to the other territories, the four regions presented in the graph above represent the evolution they have followed since the start of national containment on April 3.
The incidence rate continued to rise until it collapsed on Easter Monday, April 5. Then, depending on the region concerned, it remained stable as in the Center region (orange curve) or continued to decrease as in Occitania (sky blue curve).
Regarding the situation in the hospital, it is still too early to observe any effects on the number of hospitalized patients or in intensive care. Indeed, when a peak in the incidence rate is reached, it usually takes two more weeks to see a peak in the hospital. The days and weeks to come will therefore make it possible to obtain a definitive answer as to the effectiveness of the containment.